An Instagram research report is a dated collection of public evidence. Read its capture date and coverage first, then compare eligible posts and open the source examples before deciding what to test. Follower counts and visible interactions provide context; they do not reveal reach, sales or why a post performed as it did.
This guide shows how to read dated Instaseer report examples reviewed on September 13, 2026. Compare this reading method with the current saved sample report or check a public Instagram account. The homepage now features a different saved sample. The Molly Tea and fictional Northline figures below retain their original September 2026 context; they do not describe today’s homepage.
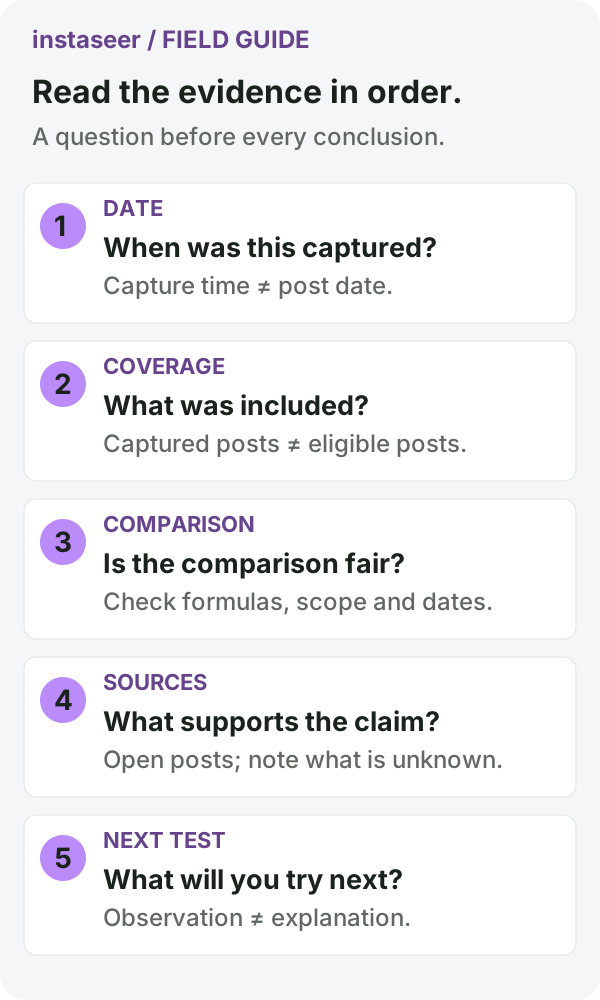
Start with when the evidence was captured
A post's publication date tells you when it appeared. A report's observation date tells you when its visible information was collected. These dates answer different questions: a January post captured in September can have September interaction counts.
The archived Molly Tea Arcadia preview was labeled Observed Sep 8, 2026 · America/Los_Angeles. Its follower card read Followers at Sep 8, 2026: 2,166. Keep that date attached when discussing the number. Do not rename it today's follower count, a January follower count or the account's average followers.
When comparing accounts, show each account's own observation date and timezone. If you typed an undated count into a worksheet, label it Follower count and record that its date is unknown. Two separately dated observations can support a change calculation; one observation cannot establish a follower-growth trend.
Check which posts are included in each number
That dated sample preview displayed 122 posts analyzed, a median of 84.5 interactions and 102 eligible posts for that median. These values belong together. The difference between captured and eligible posts matters because not every captured post necessarily has the metrics required by a calculation.
| Displayed value | What to check before using it |
|---|---|
| 122 posts analyzed | The captured report size. Check the report's date coverage and filters before calling it every post ever published. |
| Median interactions: 84.5 | The middle of the eligible post values, or the mean of the middle pair. A decimal median does not mean half an interaction was observed on a post. |
| 102 eligible posts | The denominator for that summary. Inspect the eligibility rule instead of substituting the full captured count. |
| 36,116 visible interactions | The displayed total under its own coverage rule. It is not a count of unique people, reach, leads or purchases. |
These are the values visible in the public homepage sample when checked on September 13, 2026. The underlying capture remains September 8. Do not divide one summary card by another unless the report confirms they use the same eligible cohort.
Keep missing metrics separate from zero
A visible zero is an observed value. An unavailable like or comment count is missing evidence. Replacing unavailable values with zero makes engagement look lower and changes the eligible sample.
For the current visible-engagement calculation, posts need both likes and comments. If one of those fields is missing, exclude that post from that calculation and report the excluded count. Keep the post in the evidence collection if it still helps answer a qualitative question.
Understand the formula before comparing percentages
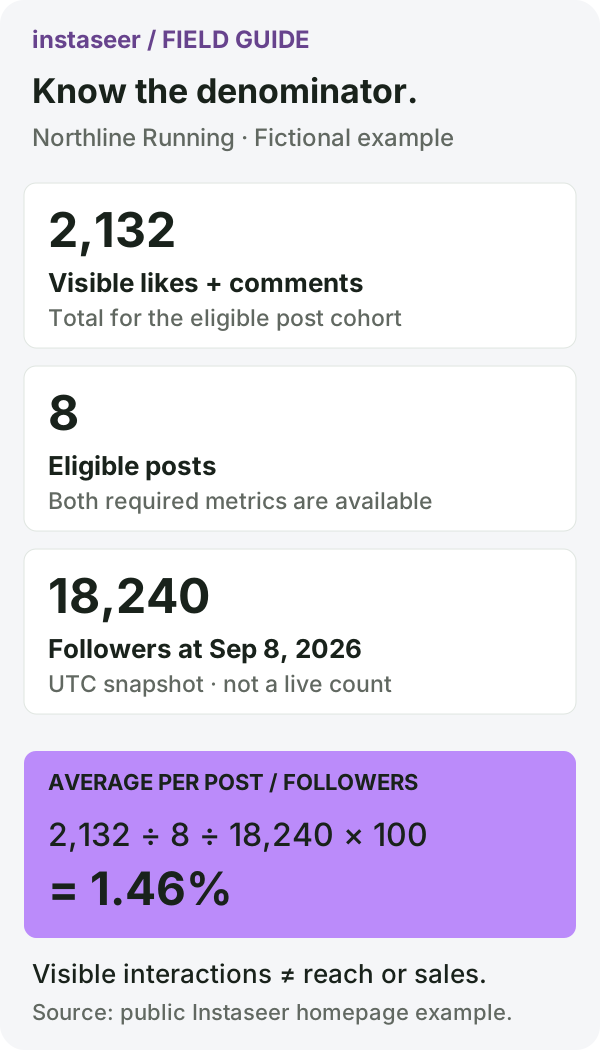
A separate, explicitly fictional Northline Running example illustrates the calculation. Its eight eligible posts have 2,132 visible interactions, with 18,240 followers observed on September 8, 2026 in the UTC snapshot. The average visible engagement per post, relative to followers, is:
2,132 ÷ 8 ÷ 18,240 × 100 = 1.46%, rounded to two decimal places.
This is a worked illustration, not the Molly Tea result or an industry benchmark. In general, divide the eligible cohort's total visible likes plus comments by its eligible post count, divide by the dated follower count, then multiply by 100. A missing or zero follower denominator cannot produce a meaningful percentage.
Use the visible engagement calculator for the calculation and the public analytics guide for the wider metric boundaries. Before comparing two percentages, confirm that both use the same formula and comparable collection rules.
Use the median and top posts to ask different questions
The median describes a typical eligible post in the selected cohort. A top-post list helps you find unusual examples worth opening. Neither tells you the cause of an outcome.
Start by opening a high-interaction post and a more typical post of the same format. Record the publication date, author or co-authors, visible creative and caption, then write what actually differs. A launch offer, creator collaboration or unusual format is a possible explanation to investigate, not proof that it caused the interaction count.
Post age also matters. Counts captured together may include an older post with more time to accumulate interactions and a recent post with less time. Use similar recency where possible, disclose the remaining mismatch and keep the underlying source links.
Read author mix without assuming paid partnerships
The V5 sample separates the account's content and observed collaborations so you can explore who appears in the evidence. Use that view to identify source posts and potential creators to investigate. Co-authorship alone does not establish a paid relationship, campaign fee or shared audience size.
For a creator shortlist, record the public handle, the source post, its date, why the creator seems relevant and what remains unknown. Verify disclosures and current availability directly before making a commercial decision. Do not infer audience authenticity or demographic fit from a follower count.
Compare accounts on an explicit basis
The account comparison tool provides a starting point for looking at two accounts. Write down the basis of comparison before choosing a winner:
- Which two accounts answer your research question, and why were they selected?
- What was captured for each, with which observation dates and timezones?
- Are post counts, publication windows, formats and recency comparable?
- How many posts qualify for each metric, and are the formulas the same?
- Which differences could reflect collection gaps or one exceptional post?
Equal sample sizes help, but eight posts from a busy week and eight posts spread across a quiet quarter still describe different situations. For cadence, inspect the posting-frequency tool and its coverage explanation. A captured sample is not proof that missing days had no posts.
Turn the report into a decision someone can check
A useful research brief separates the observation from your interpretation and next action. Copy this structure into your notes or the competitor report template:
- Question: What decision are we trying to make?
- Observation: What do these specific dated source posts show?
- Interpretation: What might explain the pattern, and what else could explain it?
- Limitation: What is missing or not comparable?
- Next test: What will we try on our own account, and which outcome will we measure?
For example, the public sample brief links a January 22, 2026 brand post introducing collectibles and a creator preview pairing drinks with opening offers. The defensible observation is that collectibles appeared in that opening story. The two posts do not prove how many people visited or bought anything. A next test could compare two clearly defined creative approaches on your own account using outcomes you are authorized to measure.
Before exporting or sharing, confirm the available control and resulting file in your actual account. Retain the observation dates, cohort labels and source links in the deliverable. A useful report lets another reader check where a conclusion came from and decide whether the proposed test is worth running.
Source and review notes
Product examples were checked against the public Instaseer homepage and saved sample entry on September 13, 2026. Molly Tea values retain the September 8, 2026 America/Los_Angeles capture label; Northline values are explicitly fictional and retain their UTC snapshot label. No private customer report or usage record is used as a public example. This draft describes observed public UI and metric rules; paid fulfillment and exact export formats were not tested for this guide.