To track Instagram follower growth, keep at least two dated follower-count observations for the same account. Subtract the earlier count from the later count. Divide that difference by the earlier count and multiply by 100 for the percentage change. Keep both observation times beside the result.
A follower count checker answers how many followers were available when the account was observed. The log below adds the missing part of a growth comparison: a retained earlier observation. This is a manual recording method, not an automatic monitoring feature.
What an Instagram follower tracker needs to record
The essential unit is an observation, not the day you opened a report. Record the account identity, the count, the source and the timestamp attached to that count. A saved example or a reused result can be older than your visit.
| Field | How to record it |
|---|---|
| Account | Keep the same verified account and source profile link. Similar names do not establish the same identity. |
| Follower count | Enter the available number, or “unavailable”. A missing count is not zero. |
| Observed at | Keep the source timestamp with its timezone or UTC offset. Your viewing time may differ. |
| Recorded at | Record when you added the row. A later transcription does not redate the evidence. |
| Source and notes | Keep the profile/report reference and any rounding, reuse or identity caveats so another reviewer can check comparability. |
In Instaseer, read the observation date on the result. Successful lookups can be reused for 24 hours, and saved examples keep their historical dates. Reopening the same observation tomorrow does not create a new measurement. See the public research methodology for the evidence boundaries.
Use this copyable log
Create one row per distinct observation. This blank template can be copied into a spreadsheet or a plain-text research note:
Account | Profile link | Follower count | Observed at + timezone | Recorded at | Source/report reference | Notes
        |              |                |                        |             |                         |
- Choose the account and the question. For example, compare the count before and after a defined research interval. Keep creative-performance questions separate.
- Save the first observation. Retain its actual timestamp and source reference. An undated manual value stays labeled “Follower count”; do not assign it a convenient past date.
- Return for another distinct observation. Confirm that the source has a later observation time. Record a reused result as reused, rather than a fresh row.
- Check comparability. Verify account identity, available counts and precision before calculating.
- Report the interval and its limits. Show the two counts, both observation dates and the arithmetic. Preserve the source rows.
How to calculate follower growth between two observations
Let the earlier count be A and the later count be B:
Net follower-count change = B − A
Percentage change = (B − A) ÷ A × 100
| Observation | Follower count |
|---|---|
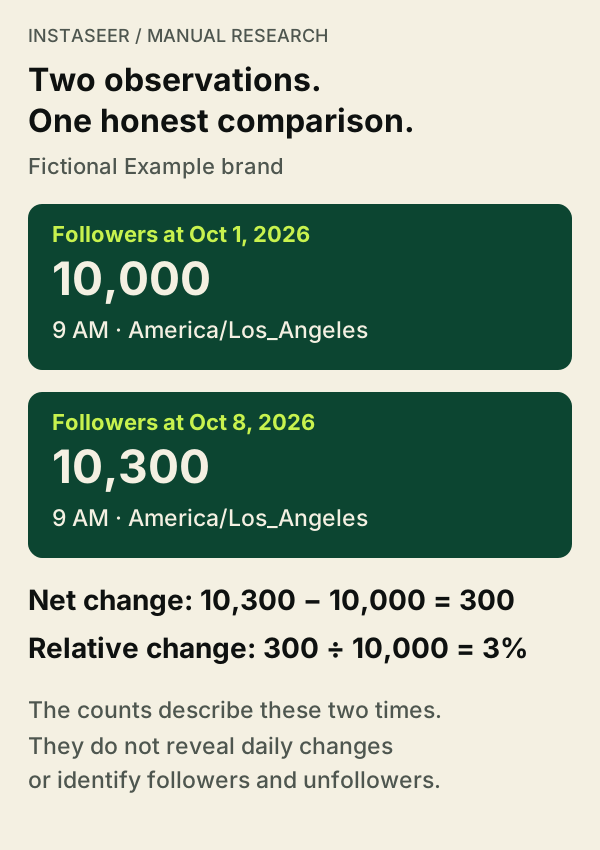
| Oct 1, 2026, 9 AM | 10,000 |
| Oct 8, 2026, 9 AM | 10,300 |
The observed difference is 10,300 − 10,000 = 300 followers. The relative change is 300 ÷ 10,000 × 100 = 3%. Write: “The observed follower count increased by 300, or 3%, between Oct 1 and Oct 8, 2026, at 9 AM America/Los_Angeles.” These are fictional figures demonstrating the calculation.
If your spreadsheet stores the earlier count in B2 and the later count in B3, =B3-B2 gives the difference. For numeric cells with B2 greater than zero, =(B3-B2)/B2 gives the relative change; format that cell as a percentage. Do not also multiply by 100 when using percentage formatting. Validate the cells first: blank or unavailable observations must not enter these formulas as zero.
A negative difference describes a net decrease. With an earlier count of zero, a numeric difference is still possible, but the percentage change is undefined. If either observation is missing, the comparison is unavailable.
Count change is not a list of new followers or unfollowers
A change from 10,000 to 10,300 is a net difference between the totals. It does not identify the people who followed or unfollowed, separate gross gains from losses, establish audience authenticity or explain the cause of the change. A follower-count lookup does not provide an individual follower list.
Keep the reporting question precise. Use public Instagram analytics to inspect available public evidence. A question about your own private reach, saves or conversions needs your authorized account analytics; those outcomes cannot be reconstructed from follower totals.
How to handle rounded counts, missed checks and reused results
- Rounded values: retain the displayed precision. A label such as “10K” does not establish an exact count of 10,000. Do not calculate a precise small change from rounded labels.
- A missed observation: leave a gap. If your next check is later than planned, use its actual observation time and describe the longer interval.
- The same source timestamp: treat it as the same observation. Two visits to one cached result do not establish an unchanged audience over that period.
- A renamed or uncertain account: verify identity before joining rows. Do not silently combine accounts because the names look related.
- A different timestamp or source: preserve it and note the difference. Do not replace the older row merely to make a cleaner chart.
Compare accounts without inventing a winner
Keep each account’s observation dates separate. If one account’s counts cover seven days and another’s cover 20, their percentage changes answer different interval questions. Align the intervals when possible, or state the mismatch and avoid ranking them as equivalent growth rates.
The Instagram account comparison tool helps inspect two public accounts using consistent definitions. Its current evidence does not supply a missing earlier follower count. For a recurring team handoff, use the monthly competitor-report guide to separate observation dates from post publication windows.
Questions to answer before sharing the log
- Can I calculate growth from one current count?
No. You need an earlier comparable observation. A current count cannot reconstruct missing history.
- Does a daily check prove what happened each day?
It supports changes between the distinct observation times you retained. It does not reveal the timing of every follow or unfollow inside each interval.
- Can I call the result monthly growth?
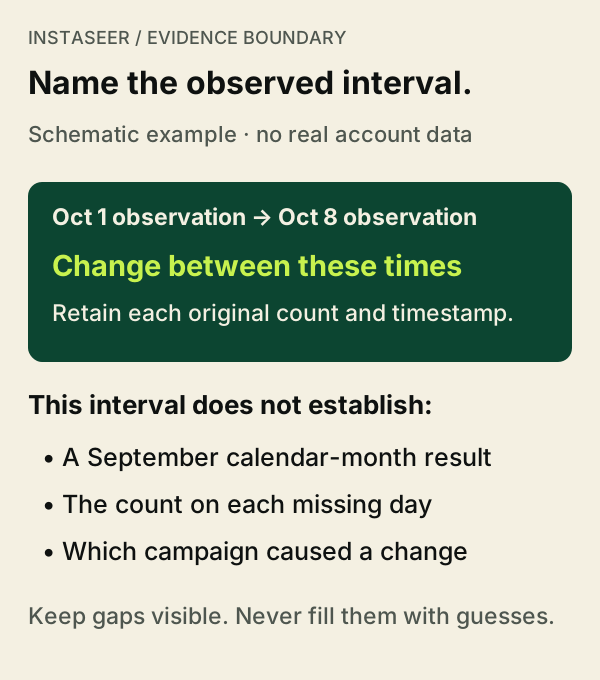
Name the exact observation interval. Counts observed mid-month do not automatically represent calendar-month boundaries.
- Does the log prove a campaign caused growth?
No. It records a difference. Explaining causation requires evidence beyond two follower totals.
Start with a dated follower-count check, keep the original observation, and return for a later observation when your research question calls for it.