To find a competitor’s most engaging Instagram posts, define the eligible cohort before sorting it, compare the top values with the median, and open the source posts. Treat a standout as an observation to investigate. A high count alone does not identify the cause, prove a repeatable tactic or justify deleting the post from the analysis.
The guide to comparing Instagram posts by engagement covers the wider comparison method. Here, the goal is narrower: understand an exceptional post without letting it distort the whole brief.
Define what “most engaging” means
Choose one metric and say what qualifies. For visible interactions, use likes plus comments only when both are available. If comments are unavailable, the combined value is unavailable; a displayed zero remains a real observation. Keep views as a separate metric instead of adding them to interactions.
Write down the selected account, publication window, format and capture date/timezone. Keep unique source posts, excluding duplicate records of the same post. If the sample includes pinned older content, decide whether it meets the publication window before ranking it.
A ranking of all returned posts answers a different question from a ranking of recent carousels. Neither is automatically wrong. The problem is changing the selection after seeing which version produces the strongest headline.
A worked example: mean 200, median 60
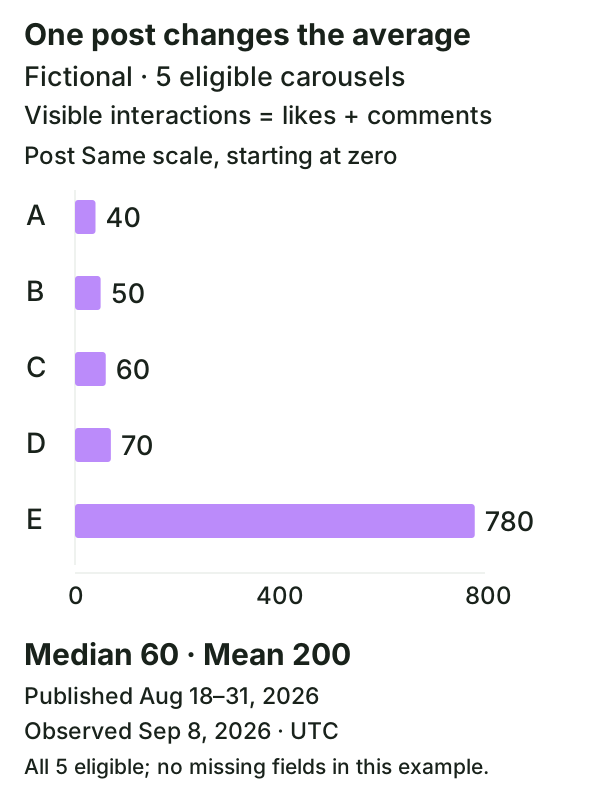
Consider five fictional carousels published August 18–31, 2026 and observed September 8, 2026 in UTC. All five have both required interaction fields. Their visible interaction values are 40, 50, 60, 70 and 780.
| Post | Visible interactions |
|---|---|
| A | 40 |
| B | 50 |
| C | 60 |
| D | 70 |
| E | 780 |
The mean is (40 + 50 + 60 + 70 + 780) ÷ 5 = 200. The median is the middle sorted value, 60. Post E contributes 780 of the 1,000 total interactions, or 78%. These summaries reveal that the mean is heavily influenced by one post; they do not show why that post received its response.
If you examine the remaining four posts as a sensitivity check, their mean is 55. Label that explicitly as an analysis excluding E and keep the full-cohort mean of 200 visible. Do not quietly replace one with the other. Five observations are also too few to characterize an account’s usual performance with much confidence.
Use a review flag, not an automatic verdict
For a small practical review, you might flag posts with at least three times the cohort median. In this fictional cohort, the review threshold would be 180 and only E would be flagged. Three times the median is an editorial triage rule here, not a platform standard or statistical significance test.
Choose that rule before searching for interesting examples and explain it in the notes. If the median is zero, the multiplier rule is unhelpful; inspect the values directly. If too many posts qualify, refine the research question rather than moving the threshold until a preferred result appears.
Open the exceptional post and a typical comparison
Check the source for duplicate records, the publication date, format and visible authorship. Read the caption and creative. Record any giveaway, launch, public announcement, offer or unusual event that could matter. A commercial disclosure may add context, but the absence of one does not prove there was no paid distribution.
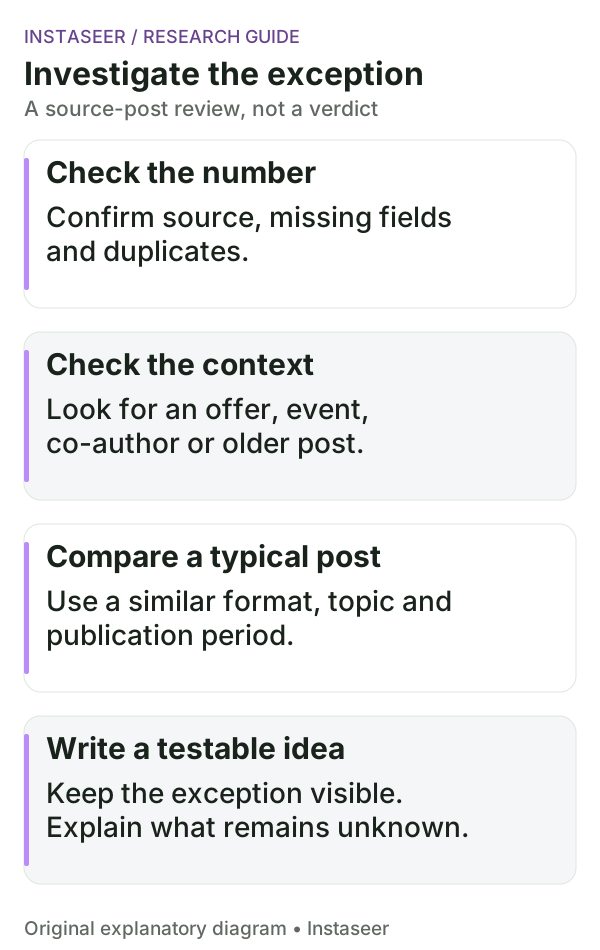
Then open a more typical post from the same format and similar period. Compare the opening idea, topic, offer and intended action. If the standout is a launch announcement and the typical post is a routine tutorial, topic and event context may explain part of the difference. You cannot attribute it solely to caption length or design.
Do not call the post viral merely because it leads a tiny sample. Do not call it fraudulent merely because it looks unusual. Visible public counts alone do not establish audience authenticity, reach, sales or the source of traffic.
Turn the investigation into a useful recommendation
A defensible fictional finding would say: “Post E accounts for 78% of visible interactions among five eligible carousels in the selected cohort. Its source presents a launch offer. We should investigate whether clear offer explanations fit our own upcoming launch.”
The next test could be an original offer explainer on the client’s account, with an agreed outcome such as qualified enquiries or authorized landing-page actions. Treat those outcomes separately from competitor public interactions. Copying the source’s creative or expecting the same count would skip the underlying business question.
Outlier review card
Cohort, format and publication window:
Observation date/timezone:
Metric definition and eligible/selected counts:
Full-cohort mean and median:
Flagging rule and exceptional source post:
Typical source post for comparison:
Visible contextual differences:
Alternative explanations and unknowns:
Original proposed test and measurable outcome:
Should outliers be removed from an Instagram report?
Correct demonstrable data errors and deduplicate the same source post. Retain valid exceptional observations in the full cohort. If a separate comparison excludes giveaways, collaborations or a particular event, disclose that rule, count the exclusions and show why it matches the question. A sensitivity analysis should add context rather than hide the result that is inconvenient.
Start your own review in the Instagram account analyzer. Keep the displayed sample limits and dates beside any ranking, then use the source links to investigate before recommending a tactic.