Competitor posting times can help you choose times to test on your own Instagram account. They cannot reveal a universal best time to post. Map publication timestamps in a declared timezone, check the sample’s coverage, and use the observed pattern to design a test with comparable content and an outcome you can measure.
Start with the Instagram posting-frequency analyzer to inspect the rhythm of returned posts. Keep your own worksheet for the test; the research workflow here does not assume automatic scheduling or access to a competitor’s private audience activity.
Which question does a posting-time chart answer?
A chart of publication times answers “When did these captured posts appear?” It does not answer “When were followers online?” or “Which time caused the most sales?” Even an interaction chart grouped by publication hour combines differences in creative, offers, distribution and elapsed time.
Write down the account, publication window, timezone and capture date. If you are reviewing two accounts, record their observation context separately. A timestamp converted to the analyst’s timezone may fall on a different day from the publisher’s local date, so choose the timezone that serves the business question.
Build a small, readable map of the evidence
For a modest sample, group publication times into a few useful buckets instead of drawing a detailed hour-by-hour chart with almost no observations. Preserve the original timestamps so you can reproduce the grouping. State whether a bucket includes its endpoint; in the example below, 9–12 means 9 a.m. up to, but not including, noon.
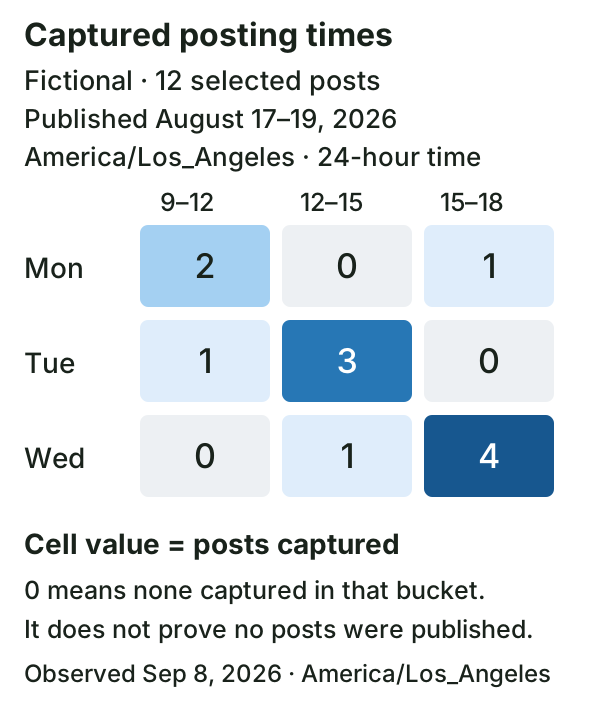
| Day | 9–12 | 12–15 | 15–18 |
|---|---|---|---|
| Mon, Aug 17 | 2 | 0 | 1 |
| Tue, Aug 18 | 1 | 3 | 0 |
| Wed, Aug 19 | 0 | 1 | 4 |
This fictional sample contains 12 selected posts in the displayed buckets, all observed September 8, 2026 in America/Los_Angeles. The darkest cell says four captured posts were published Wednesday from 3 p.m. to before 6 p.m. It says nothing about how those posts performed. A zero means none were captured in that cell; incomplete collection could still omit published posts.
The current free tool describes up to 25 returned posts, possibly including pinned content or fewer usable records. That sample may be too narrow to establish an account’s normal weekly pattern. A quiet-looking Monday in a partial sample is not evidence that Monday is a bad publishing day.
Choose candidate times that fit your account
Use the competitor evidence as one input alongside the client’s audience information, operating hours and ability to respond. If the client supplies its own audience activity data, keep that first-party evidence distinct from public competitor publication times.
Pick two times you can actually sustain. For a fictional local studio, Tuesday at 10 a.m. and Tuesday at 4 p.m. might be candidates because the team can answer enquiries in both periods. Those times are examples of a test choice, not a claim about Instagram-wide performance.
Design a comparison that limits avoidable differences
Use the same format and a comparable offer in each condition. Alternate the times across a series of original posts so one time is not reserved for the strongest campaign idea. If a holiday, event or promotion changes the context, record it rather than treating that post as interchangeable with routine content.
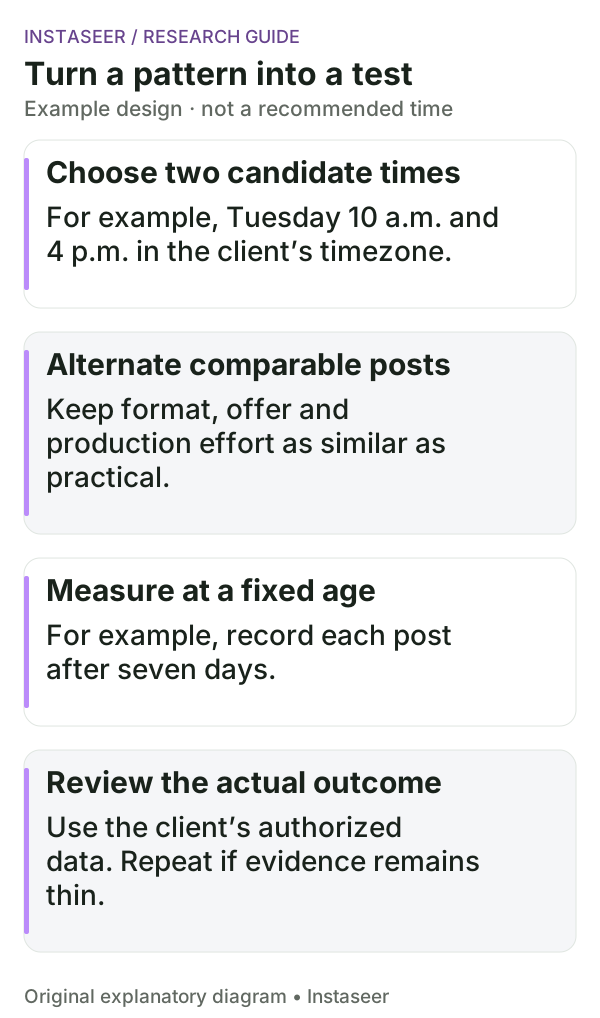
For an exploratory plan, the studio could publish one comparable carousel each Tuesday over four weeks, alternating 10 a.m., 4 p.m., 4 p.m. and 10 a.m. Two posts per condition are very little evidence; this is a practical starting exercise, not a sufficient sample for a confident general conclusion. Extend the test when the decision warrants it and production capacity allows.
Choose the measurement age in advance, such as seven days after each post. Comparing one post after a day and another after three weeks would give them different accumulation time. Retain the actual observation timestamps if you miss the planned measurement moment.
Measure the intended outcome
If the objective is enquiries, use the client’s authorized enquiry records and a consistent attribution method. If the objective is video completion, use the client’s own available video metrics. Visible likes plus comments can be a secondary measure, but they do not substitute for a missing business outcome.
Review individual posts and the range of outcomes, not just one average per time. If one strong offer explains the apparent difference, another timing round with more comparable content may be more useful than changing the entire calendar. If outcomes are unavailable or inconsistent, report the test as inconclusive.
Posting-time test plan
Account and audience question:
Timezone:
Candidate time A / time B:
Why these times are practical:
Content format, offer and comparison rules:
Sequence and owner:
Primary outcome and authorized data source:
Fixed measurement age:
Exceptions to record:
Review date and criteria for the next decision:
What if the competitor’s strongest posts all appear at one time?
Inspect whether that time also contains launches, collaborations or the account’s most frequent format. A concentration of strong posts is a hypothesis worth investigating, not proof that the clock caused the response. Compare source examples in the account comparison tool, then test an appropriate schedule with your own content and outcome data.